
Get in Touch with GUANGQI


Lumens vs Lux: How to Convert Light Output into Target-Surface Illuminance
Lumens vs lux explained with formulas, worked examples, and target-surface checks. Convert light output into auditable illuminance for real projects.

Updated August 2026 Technical Guide For Lighting Buyers, Facility Teams, Contractors And Specifiers
Lumens vs lux is the difference between source output and a surface result. Lumens measure luminous flux from a light source. Lux measures illuminance incident on a surface. Exactly 1 lux equals 1 lumen per square meter in SI units. What is not exact is converting a fixture’s catalog lumen value into real target-surface illuminance without distribution, geometry, and loss data.
This guide shows three legitimate calculation routes, four worked examples, and the evidence needed before a number becomes a lighting decision. One central rule applies: dividing useful incident lumens by a defined area gives area-average illuminance. It does not guarantee the value at every point, uniformity, glare control, or maintained site performance.
Key takeaway
Use lumens to describe total light output. Use lux to describe light on a defined target plane, then verify distribution, geometry, maintenance, and measurement conditions.
1. Lumens vs Lux: The Practical Difference
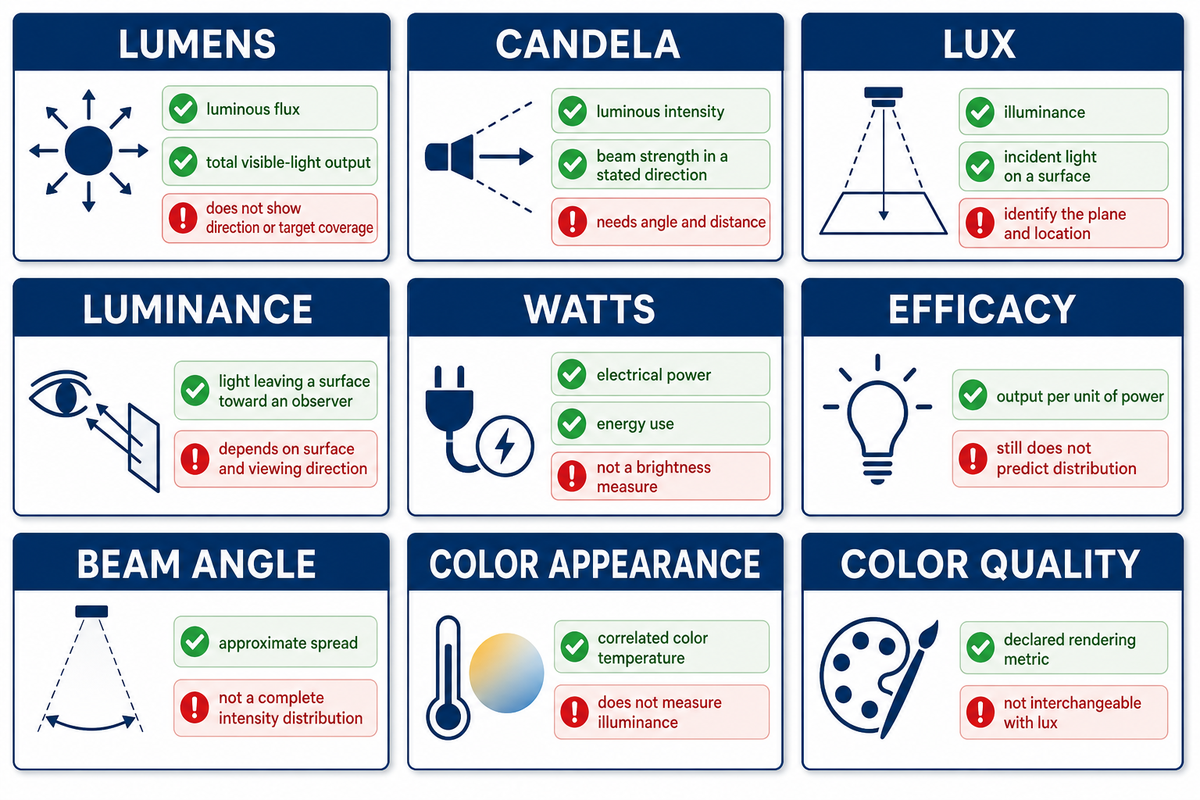
The practical difference between lux and lumens is location. One lumen belongs to the emitted or transmitted luminous flux. One lux value belongs to a point or an average over a stated surface. That is why two LED lights with equal lumen ratings can illuminate a work plane very differently.
NIST lists illuminance in lux as a coherent SI derived unit expressed in lumens per square meter.
The unit identity needs no uniformity condition. One lux is one lumen per square meter. Uniformity becomes relevant when you try to infer point values from a whole-plane average. Keeping those statements separate prevents a correct unit equation from becoming a false fixture promise.
| Type | Quantity | Unit | Use it for | Limitation |
|---|---|---|---|---|
| Output | Luminous flux | lumen (lm) | Total amount of visible light | Does not show direction or target coverage |
| Direction | Luminous intensity | candela (cd) | Beam strength in a stated direction | Needs angle and distance |
| Surface | Illuminance | lux (lx) | Incident light on a surface | Must identify plane and location |
| Appearance | Luminance | cd/m² | Light leaving a surface toward an observer | Depends on surface and viewing direction |
| Input | Electrical power | watt (W) | Energy use | Not a brightness measure |
| Efficiency | Luminous efficacy | lm/W | Output per unit of power | Still does not predict distribution |
| Optics | Beam angle | degree | Approximate spread | Not a complete intensity distribution |
| Color | Correlated color temperature | kelvin (K) | Color appearance | Does not measure illuminance |
| Color quality | Color rendering | declared metric | Object color evaluation | Not interchangeable with lux |
A familiar LED bulb package often emphasizes watts and lumens because those values are easy to compare at the source. Project briefs need more. When the question is how bright a surface will be, the relevant outcome is illuminance, and that outcome depends on where the light source is placed and how its beam reaches the plane.
Adjacent searches such as candela vs lux, lumens vs lux vs watts, and lux vs lumens vs candela are useful only when each quantity keeps its own job: intensity, electrical input, source flux, or surface illuminance.
Normalize Search Wording Before You Calculate
Search fragments often collapse different lighting quantities into one phrase. This normalization table keeps the wording visible for readers while translating it into an engineering question rather than treating it as a specification.
| Search wording | Engineering question | Boundary to preserve |
|---|---|---|
| lumens and lux; what’s the difference; understand the difference; different from lumens; help you understand | Are we describing source flux or surface illuminance? | Comparison wording does not create a direct fixture conversion. |
| one lux equals one lumen; equals one lumen; equals one lumen per; 1000 lux; 100 lumens | What area and incident flux make the unit statement complete? | The full identity is one lumen per square meter. |
| emitted by a source; light is emitted; light emitted by a source; lumens is the total | Is the number total emitted flux or useful flux on the target? | Catalog output is not automatically incident output. |
| measure the amount of light; measures how much light; describes the amount of light; quantity of light | Which photometric quantity and unit does the measurement represent? | A meter reading needs a plane, point, orientation, and conditions. |
| amount of lux; lux describes light; lux takes; lux is used; falls on a surface | Where on the surface is illuminance stated or measured? | Lux is a surface result, not a quantity stored inside a lamp. |
| lumens and candela; 1 candela; intensity of light; determine the intensity; different aspects of light | Do we need total flux or directional luminous intensity? | Candela requires a direction; lumens aggregate flux. |
| inverse square law; depends on distance; smaller area; light is evenly distributed; higher the lux | Which geometry, distance, distribution, and area assumptions apply? | Point estimates and area averages are different claims. |
| lux rating; ambient lighting; integrating sphere; architectural lighting; lighting products; bright led | Is the evidence a source-output test, a field reading, or an application result? | Test method, application, and acceptance conditions must remain explicit. |
2. How to Convert Lumens into Target-Surface Lux
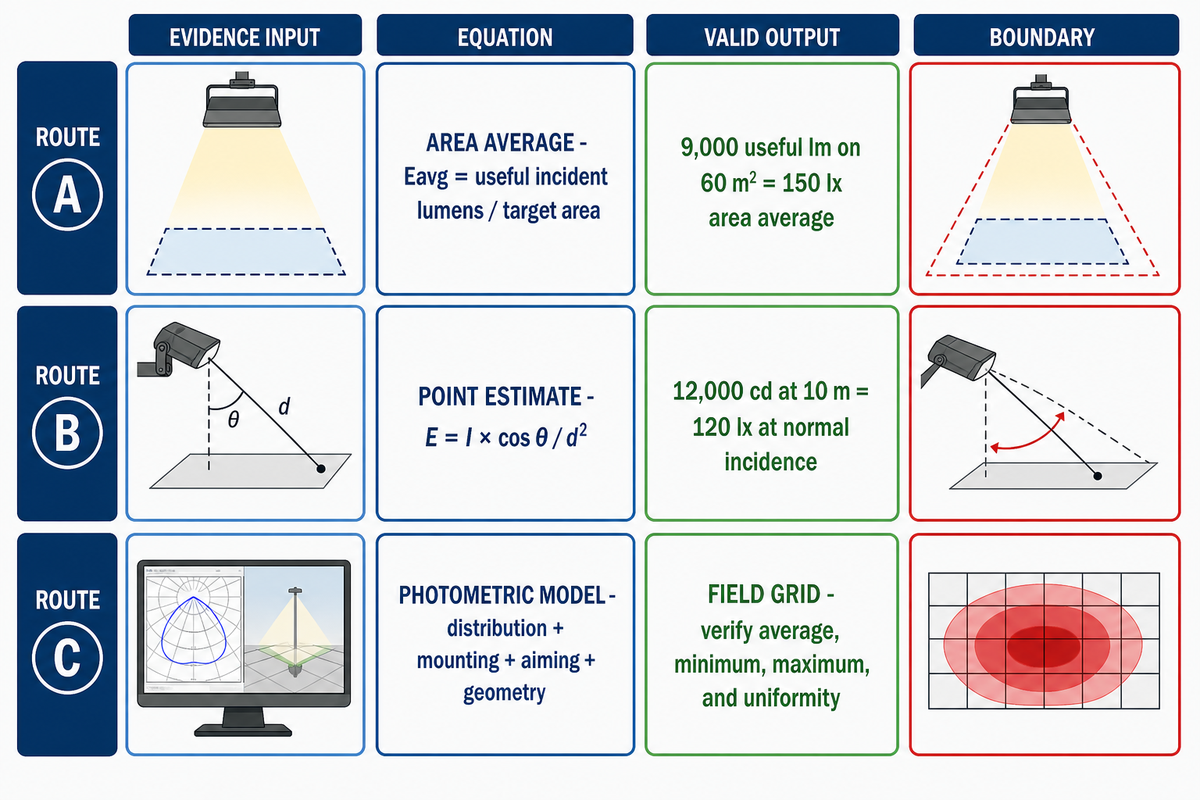
With the light quantities and their boundaries separated, there are three defensible routes in a lumens vs lux calculation. Choose the route by the evidence available, not by the answer you want. For transparent early sizing, a uniform-area estimate is useful. Candela calculations estimate a point. Photometric models handle real luminaire distributions, overlap, mounting, aiming, and geometry.
Route A: useful incident lumens divided by area
Eavg (lx) = Φplane (lm) / A (m²). This is the surface-density relationship behind the IES definition of illuminance.
Here, Φplane means useful lumens actually incident on the defined plane. It isn’t automatically the total amount of light emitted by the fixture. If 9,000 useful incident lumens reach a 60 m² plane, the result is 9,000 / 60 = 150 lx area average. That statement doesn’t establish a 150 lx minimum, a 150 lx hotspot, or perfectly even illumination.
Route B: candela, distance, and incidence angle
E (lx) = I (cd) × cos θ / d²
This route asks how much light intensity exists in the direction of the target. For a point source or valid far-field approximation, 12,000 cd at 10 m and normal incidence gives 12,000 / 10² = 120 lx. At a 30-degree incidence angle, it becomes 12,000 × cos 30° / 100 = 103.92 lx, or about 104 lx.
One distance-sensitivity check makes the square term visible. Under the same perpendicular far-field model and the same 12,000 cd directional intensity, the estimate is 480 lx at 5 m, 120 lx at 10 m, and 30 lx at 20 m. These are point estimates under a bounded model, not site-wide averages.
Inverse-square behavior isn’t a license to treat a large, nearby luminaire as a perfect point source. Near-field geometry, extended emitters, lens shape, obstructions, and the selection of candela direction can invalidate any shortcut. Use a candela table or a photometric file and specify the boundary.
Route C: photometric calculation and a field grid
A real lighting design blends luminaire photometry with mounting height, spacing, tilt, orientation, target geometry, obstructions, surface positions, overlap, depreciation, and controls. For a defined grid, the model may report average, minimum, maximum, and uniformity. Field readings then verify the installed condition.
- Define the outcome — name the task, target plane, governing criterion, and whether the value is initial or maintained.
- Collect the photometry — obtain the tested lumen output, intensity distribution, beam data, and usable photometric file.
- Build the geometry — place luminaires, target surfaces, obstructions, tilt, orientation, and calculation points.
- Apply stated losses — separate utilization assumptions from the maintenance factor and document each input.
- Calculate the grid — review average, minimum, maximum, uniformity, glare or spill metrics required by the project.
- Verify the installation — record meter, operating state, ambient contribution, grid, and acceptance results.
Red flag: a calculator that takes only total lumens and returns one exact site lux number is hiding assumptions. It hasn’t been given enough information to determine distribution, distance, angle, losses, or spatial variation.
3. Worked Lumens-to-Lux Conversions
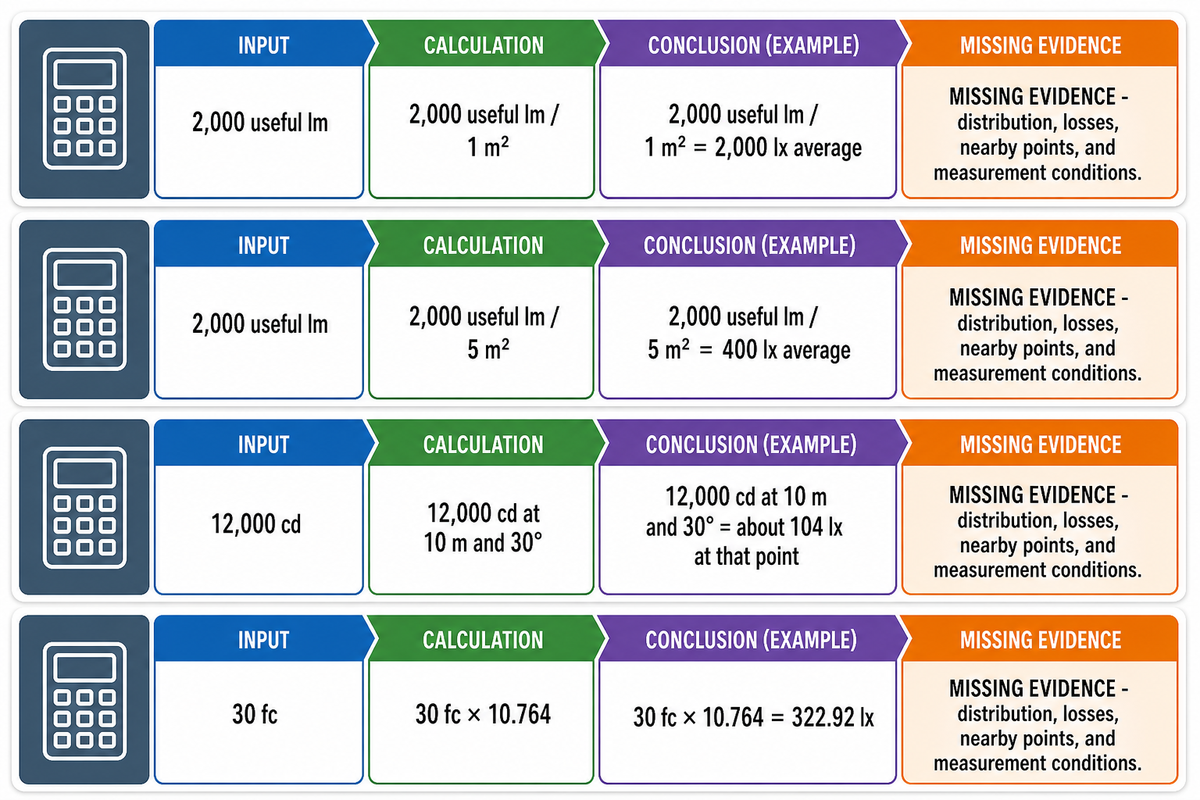
Worked examples are helpful only when every assumption is visible. Those missing distribution, distance, angle, and loss inputs carry into the examples that follow. This table separates arithmetic from evidence. None of these rows constitute a fixture guarantee.
| Scenario | Known inputs | Calculation | Valid conclusion | Missing evidence |
|---|---|---|---|---|
| Defined 1 m² plane | 2,000 useful incident lm | 2,000 / 1 | 2,000 lx average | Spatial distribution and losses |
| Defined 5 m² plane | 2,000 useful incident lm | 2,000 / 5 | 400 lx average | Minimum, maximum, uniformity |
| Directional point | 12,000 cd, 10 m, 30° | 12,000 × 0.866 / 100 | About 104 lx at that point | Far-field validity and nearby points |
| Foot-candle conversion | 30 fc | 30 × 10.764 | 322.92 lx | Where and how the reading was taken |
That foot-candle row is a unit conversion, not a lumens-to-lux prediction. This relation is also listed in the NIST conversion factors appendix: 1 fc = 10.764 lx. Location, orientation, instrument, and operating state remain unknown but still affect the reading.
Common inquiries ask if 500 lux equals 500 lumens. It doesn’t. If a defined plane receives 500 useful incident lumens across 1 m², the area average becomes 500 lx. If the same useful flux covers 5 m², the average is 100 lux. Larger areas alter the surface density even though the lumen quantity doesn’t.
A 10-case numerical sanity-check register
Functional lumens versus lux worksheets should answer straightforward boundary tests before they’re trusted with an actual site. Rows one through three keep useful incident flux constant and alter only area. Rows four through six preserve directional intensity and vary the distance under a perpendicular far-field model. Remaining rows invert the area equation, convert foot-candles, and separate initial from maintained illuminance.
| Check | Inputs | Expected result | What the result means | Boundary |
|---|---|---|---|---|
| Area 1 | 1,000 lm on 1 m² | 1,000 lx average | Flux density across the named plane | Not every point unless distribution is known |
| Area 2 | 1,000 lm on 2 m² | 500 lx average | Doubling area halves the average | Useful incident lumens held constant |
| Area 3 | 1,000 lm on 10 m² | 100 lx average | Larger coverage lowers flux density | No beam or uniformity conclusion |
| Distance 1 | 100 cd at 1 m | 100 lx at the point | Perpendicular intensity-distance result | Valid model required |
| Distance 2 | 100 cd at 2 m | 25 lx at the point | Double distance gives one quarter | Same directional intensity |
| Distance 3 | 100 cd at 4 m | 6.25 lx at the point | Four times distance gives one sixteenth | Near-field effects excluded |
| Reverse area 1 | 500 lx across 10 m² | 5,000 useful lm | Incident flux required on the plane | Not total fixture lumens |
| Reverse area 2 | 500 lx across 40 m² | 20,000 useful lm | Four times area needs four times incident flux | Distribution still unresolved |
| Foot-candle | 25 fc | 269.1 lx | Unit conversion only | Measurement conditions unchanged |
| Maintenance | 150 lx initial × 0.80 | 120 lx maintained | Explicit factor applied after the initial estimate | Factor must be project justified |
These tests identify different failure modes. If a worksheet produces 500 lx for both 1,000 lm on 1 m and 1,000 lm on 2 m, its area logic is flawed. If it yields 50 lx for 100 cd at 2 m, its inverse-square stage is incorrect. If it marks 5,000 useful lm as total luminaire output, it has quietly ignored utilization and optical losses.
These checks don’t qualify the worksheet as a photometric model. They merely confirm that basic arithmetic and labels behave consistently. Actual luminaires can distribute radically different proportions of their total flux on the calculation plane. Models must also assess how overlapping beams fill every grid point, how obstructions modify the outcome, and if the selected maintenance assumptions suit the environment.
For procurement purposes, include the calculation inputs rather than just the final lux figure. Reviewers should be able to reproduce the calculation, pinpoint every assumed value, and substitute it when tested product photometry is accessible. This makes an early estimate useful without allowing it to masquerade as a performance guarantee.
4. Why the Same Lumens Can Produce Different Lux
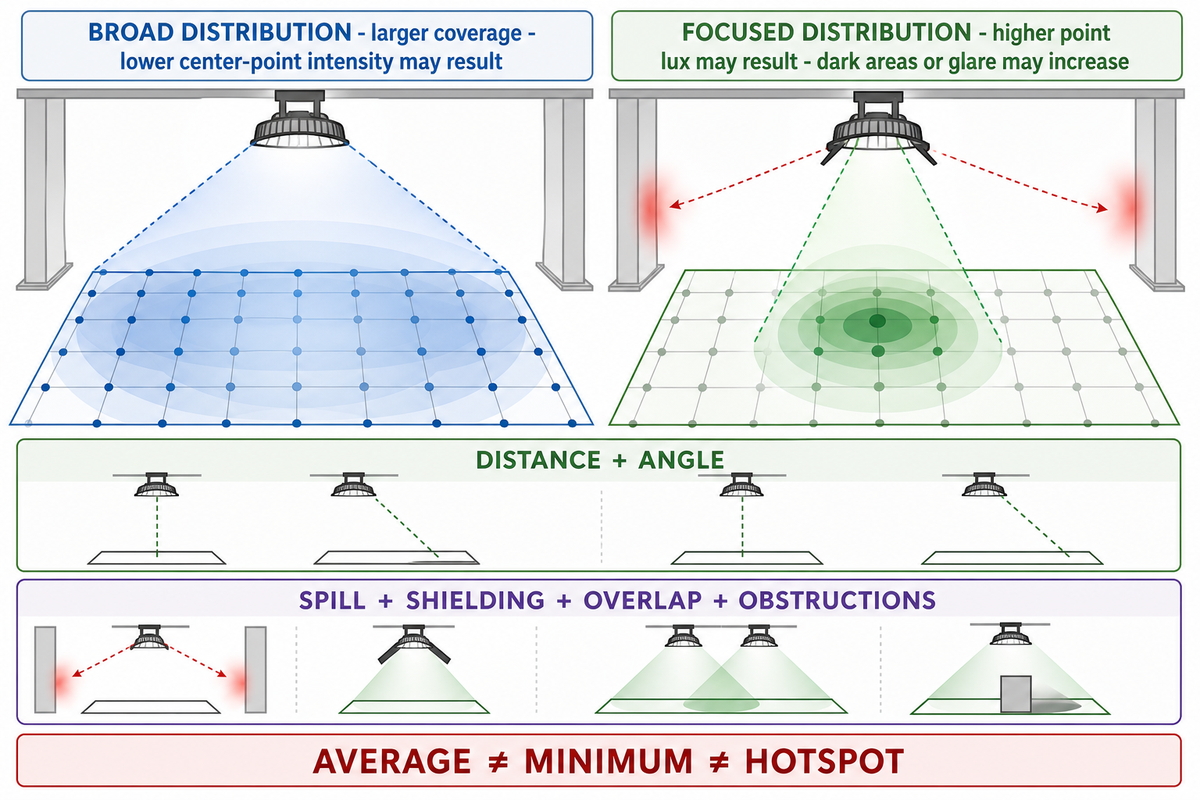
The same lumens can create different lux because luminaires distribute the luminous output differently. One optic can focus more candela in the aiming direction. Another can cover a wider area. The first may give a higher lux reading in one area while its uniformity is poorer or it creates more discomfort glare. The IES Lighting Library separates fundamentals, calculations, measurements, and application guidance for this reason.
High lumen output, broad distribution
- Spreads flux across more directions
- May illuminate a larger area
- Can lose more light outside the target
- May produce lower center-point intensity
Lower lumen output, focused distribution
- Concentrates intensity in selected directions
- May raise point lux at distance
- Can leave dark areas between beams
- May increase glare if poorly aimed
Distance has a pronounced effect in the point-source far field. Doubling the distance drops the perpendicular point illuminance to ¼ when the intensity in that direction remains constant. Incidence angle affects the point because an oblique beam projects the same directional contribution over the receiving geometry differently.
Installed performance introduces additional variables: shielding, tilt, overlaps, pole placement, facades, tree height, dirt, lumen depreciation, voltage, control state, ambient light. Lux readings taken at one distance can’t be simply transferred to another distance without the appropriate model. Hotspots don’t constitute the entire calculation grid.
Do
- Ask for directional photometric data
- State mounting height and aiming
- Separate average from minimum
- Record initial and maintained results
Don’t
- Divide catalog lumens by nominal site area
- Call one hotspot an average
- Assume more lumens always performs better
- Ignore glare, spill, or uniformity
5. The 5-Row Output-to-Outcome Ledger
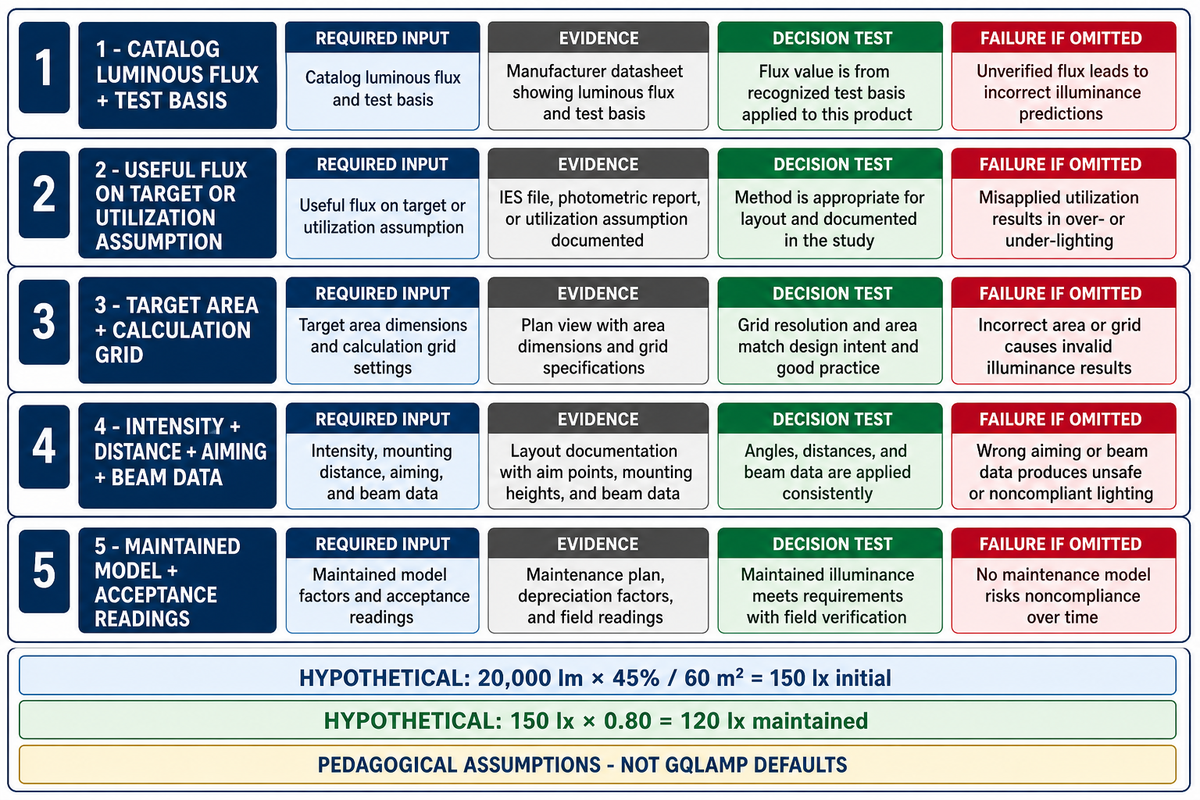
The Output-to-Outcome Ledger converts a sales-page lumen number into an auditable trail. That ledger makes the previous section’s distribution, glare, spill, and uniformity variables explicit. Each row states what’s known, what’s assumed, and what must be validated against the applicable resources in the IES Lighting Library. It functions as a decision-making tool, not a new lighting standard.
| Row | Required input | Evidence | Decision test | Failure if omitted |
|---|---|---|---|---|
| 1 | Catalog luminous flux and test basis | Current datasheet or test report | Is the lumen value defined and comparable? | Unknown starting output |
| 2 | Useful flux on the target or utilization assumption | Photometry or labeled estimate | How much output reaches the plane? | Total flux is mistaken for incident flux |
| 3 | Area and calculation grid | Plan, dimensions, point layout | What surface and statistics are reported? | Undefined denominator and sampling |
| 4 | Intensity, distance, aiming, and beam data | Candela table or photometric file | Does the beam reach the intended points? | Direction and geometry disappear |
| 5 | Maintained model and acceptance readings | Assumptions, calculation report, field record | Did the installed outcome meet the brief? | Initial estimate becomes an unsupported promise |
Imagine a hypothetical 20,000-lumen outdoor luminaire. If an initial model assumes that 45% of the output reaches a 60 m² target plane, useful incident flux is 20,000 × 0.45 = 9,000 lm. The initial area average is 9,000 / 60 = 150 lx. If the project also separately adopts a documented 0.80 maintenance factor, the maintained estimate is 150 × 0.80 = 120 lx.
Those percentages are pedagogical assumptions, not GQLAMP requirements and not default values. A project must substitute photometric and maintenance inputs appropriate to the selected product, site, cleaning cycle, hours of operation, and governing design approach.
6. Verify Lux on the Target Surface
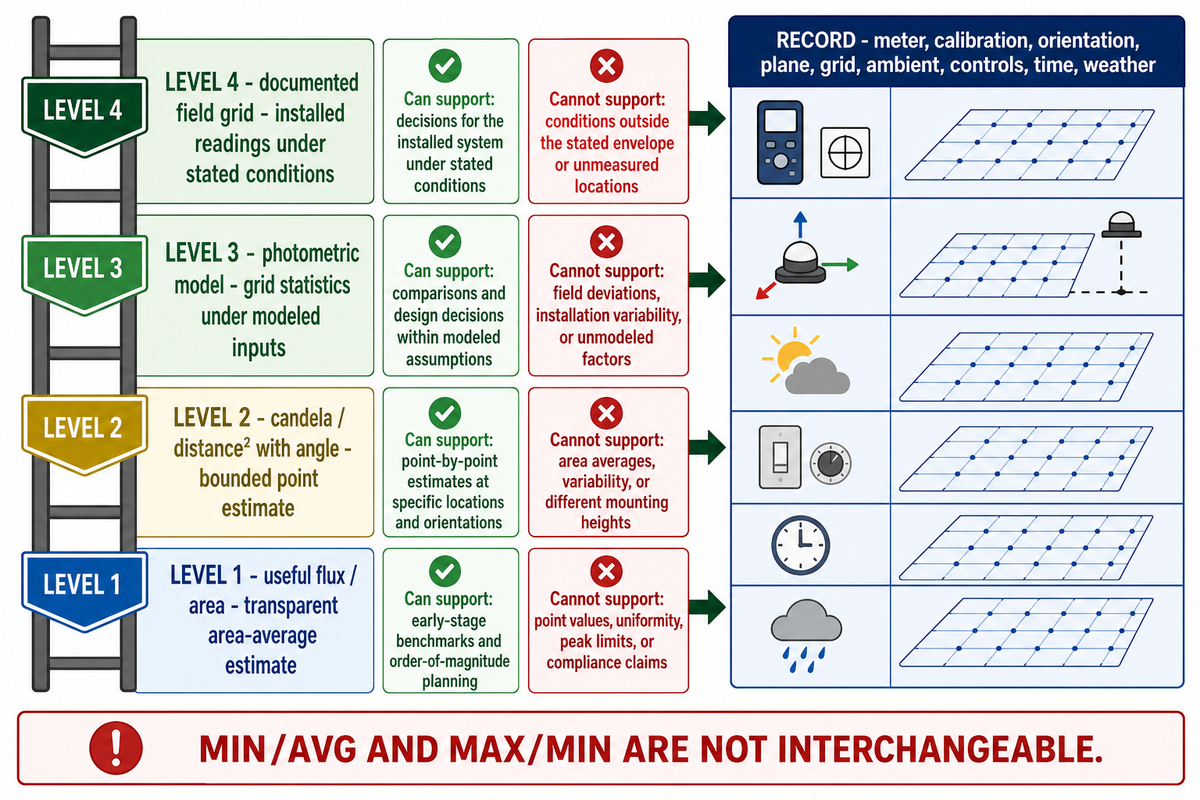
Lux meters measure illuminance but a lux level is only as useful as its location and circumstances. Those project-specific photometric and maintenance inputs carry into the ledger’s final verification row. Field measurement begins by referencing the plane and grid, not by walking to the brightest place. State whether the reading includes ambient light, which circuits and control states are operating, and whether the system has reached thermal or other stability.
| Level | Method | What it can support | What it cannot support |
|---|---|---|---|
| 1 | Useful flux / area | Transparent area-average estimate | Point values or uniformity |
| 2 | Candela / distance² with angle | Bounded point estimate | Whole-site distribution |
| 3 | Photometric model | Grid statistics under modeled inputs | Installation deviations and field conditions |
| 4 | Documented field grid | Installed readings under stated conditions | Unmeasured states or uncertainty-free truth |
ISO/CIE 19476 introduces a critical limit: measurement accuracy depends on operating conditions, properties of the light source, photometer characteristics, calibration conditions, and instrument quality indices. The meter’s label alone cannot determine uncertainty for a specific task. LED spectral mismatch and angular response may matter, so document the instrument and use the applicable measurement procedure.
A field log should note the meter make/model, calibration status, sensor orientation, plane height, grid point names, ambient state, control state, power condition, time, weather where relevant, and each reading. Determine the mean, min and max only from the validated grid. State the preferred uniformity notation as min/avg and max/min aren’t interchangeable.
Acceptance principle: agree on the plane, grid, control state, statistics, instrument condition, and tolerance before energization. Otherwise two people with valid readings can still disagree about the outcome.
7. Apply the Method to Commercial Outdoor Lighting
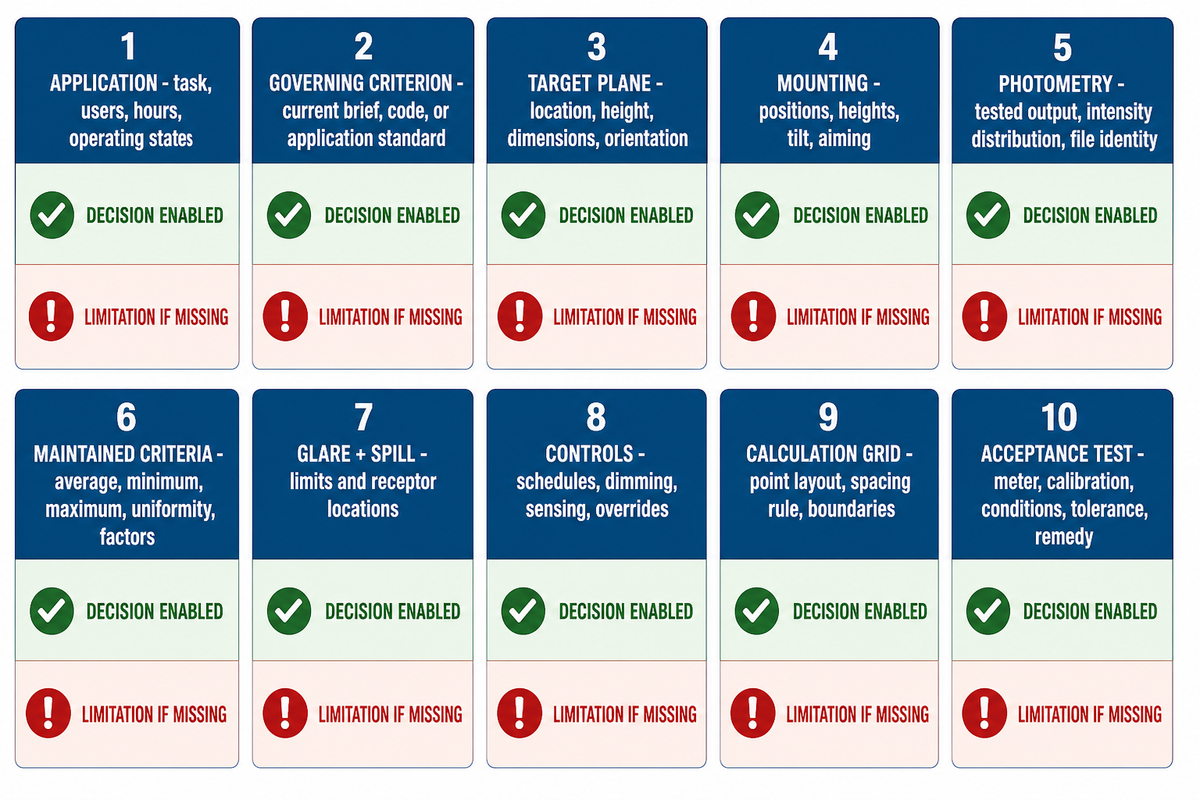
For outdoor work areas, yards, facades, streets, parking and sports fields, it isn’t just “highest lux.” After project teams fix the plane, grid, and acceptance conditions, they can carry the same method into outdoor applications. It’s about having an application-specific visual result including appropriate maintained illuminance, spatial distribution, glare and spill control, operating logic, and environmental constraints.
The current IES outdoor position says light should be useful, targeted, no brighter than necessary, controlled, and selected for context. Its current resource list includes application documents for exterior environments and roadway or parking facilities. The IES standards cross-reference also warns against relying on old handbook or superseded-document references.
An older CIE exterior-work-area guide illustrates why lux is only one dimension: it considers maintained average illuminance, uniformity ratios, glare, color quality, maintenance, environmental aspects, design, and measurement. Use that as scope context, not as a source of current project target values. The project brief and current applicable standard control.
When product selection begins, the existing commercial outdoor lighting category is the approved commercial handoff. It shows the relevant flood-light family and optical options. It does not replace a project photometric calculation. Teams that need layout support can also review GQLAMP’s lighting design services, while early-stage users can test the site’s outdoor flood-light wattage calculator or stadium fixture-count calculator as preliminary planning aids.
For adjacent decisions, the workplace lighting criteria guide explains why task context matters, the LED flood-light wattage guide separates power from application needs, and the lighting IP rating guide addresses environmental enclosure selection. These are related inputs, not substitutes for target-surface evidence.
| Item | What to provide | Decision enabled | Limitations if missing |
|---|---|---|---|
| 1. Application | Task, users, hours, operating states | Correct performance question | No context for a target |
| 2. Governing criterion | Current brief, code, or application standard | Defined target and statistics | Generic values may be wrong |
| 3. Target plane | Location, height, dimensions, orientation | Valid area and points | Lux has no defined surface |
| 4. Mounting | Positions, heights, tilt, aiming | Geometry and distance | Intensity cannot be placed |
| 5. Photometry | Tested output, intensity distribution, file identity | Modeled beam performance | Catalog output only |
| 6. Maintained criteria | Average, minimum, maximum, uniformity, factors | Life-cycle evaluation | Initial result may mislead |
| 7. Glare and spill | Applicable limits and receptor locations | Visual comfort and boundary control | Equal lux may have unequal harm |
| 8. Controls | Schedules, dimming, sensing, overrides | State-specific performance | Readings lack an operating state |
| 9. Calculation grid | Point layout, spacing rule, included boundaries | Comparable statistics | Hotspots can dominate |
| 10. Acceptance test | Meter, calibration, conditions, tolerance, remedy | Clear installed sign-off | No shared pass/fail method |
Send this packet with the request for quotation. It changes the discussion from “How many lumens is this fixture?” to “What maintained outcome will this tested distribution produce on our named plane, and how will we accept it?”
8. Lumens vs Lux FAQ
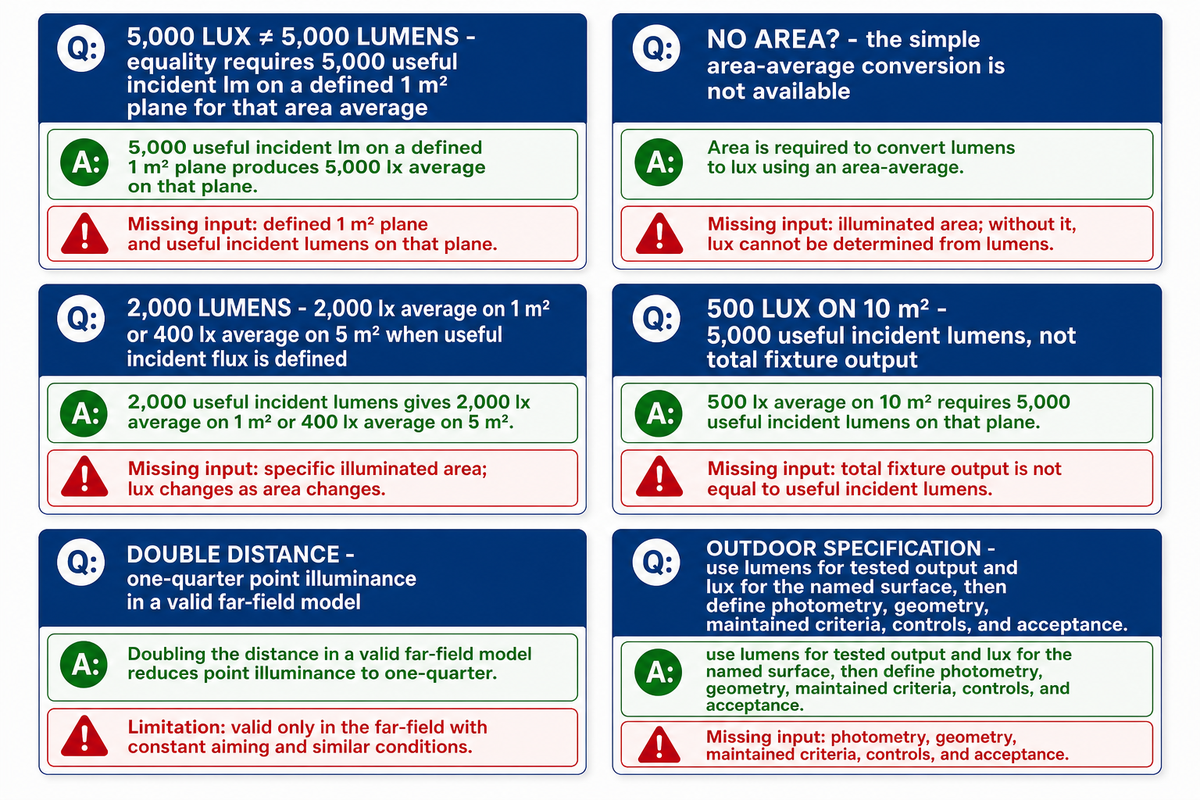
Is 5,000 lux the same as 5,000 lumens?
No. Five thousand lumens is luminous flux from or through a source, while 5,000 lux is illuminance on a defined surface. If 5,000 useful incident lumens reach a 1 m² plane, the whole-plane average is 5,000 lx. That still doesn’t prove that every point is at 5,000 lx. Minimum, maximum, uniformity, angle, distance, and losses require separate evidence.
Can you convert lumens to lux without area?
Not with the simple area-average formula. You need useful incident flux and the target area. For a directional point estimate, use candela in the target direction, distance, and incidence angle. A photometric file and complete site geometry are the better route for real luminaires because they model intensity distribution, overlap, orientation, and obstructions.
How many lux is 2,000 lumens?
There is no universal answer. If 2,000 useful incident lumens reach a defined 1 m² plane, the area average is 2,000 lux. If the same useful flux reaches 5 m², the average is 400 lux. A real fixture also needs beam distribution, distance, incidence angle, spill, overlap, depreciation, and grid evidence before those averages can guide selection.
What is 500 lux in lumens?
On a 10 m² plane, 500 lx average means 5,000 useful incident lumens. It doesn’t reveal total fixture output.
Why does lux fall with distance?
In a valid point-source far-field model, doubling distance from 10 m to 20 m reduces perpendicular point illuminance to one quarter, such as 120 lx to 30 lx when directional intensity stays unchanged. The IES illuminance definition identifies the point-level surface quantity; large nearby sources may require full photometric modeling.
Should an outdoor specification use lumens or lux?
Use both, but assign them different jobs. Lumens document tested source output; lux defines illuminance on the named surface. Then specify the photometric file, mounting geometry, maintained average and minimum criteria, uniformity expression, glare and spill limits, control states, environmental constraints, calculation grid, meter conditions, tolerance, and acceptance remedy. Equal lux alone can’t prove equal visibility, visual comfort, boundary control, maintenance performance, or outdoor suitability.
Convert Output into an Auditable Outcome
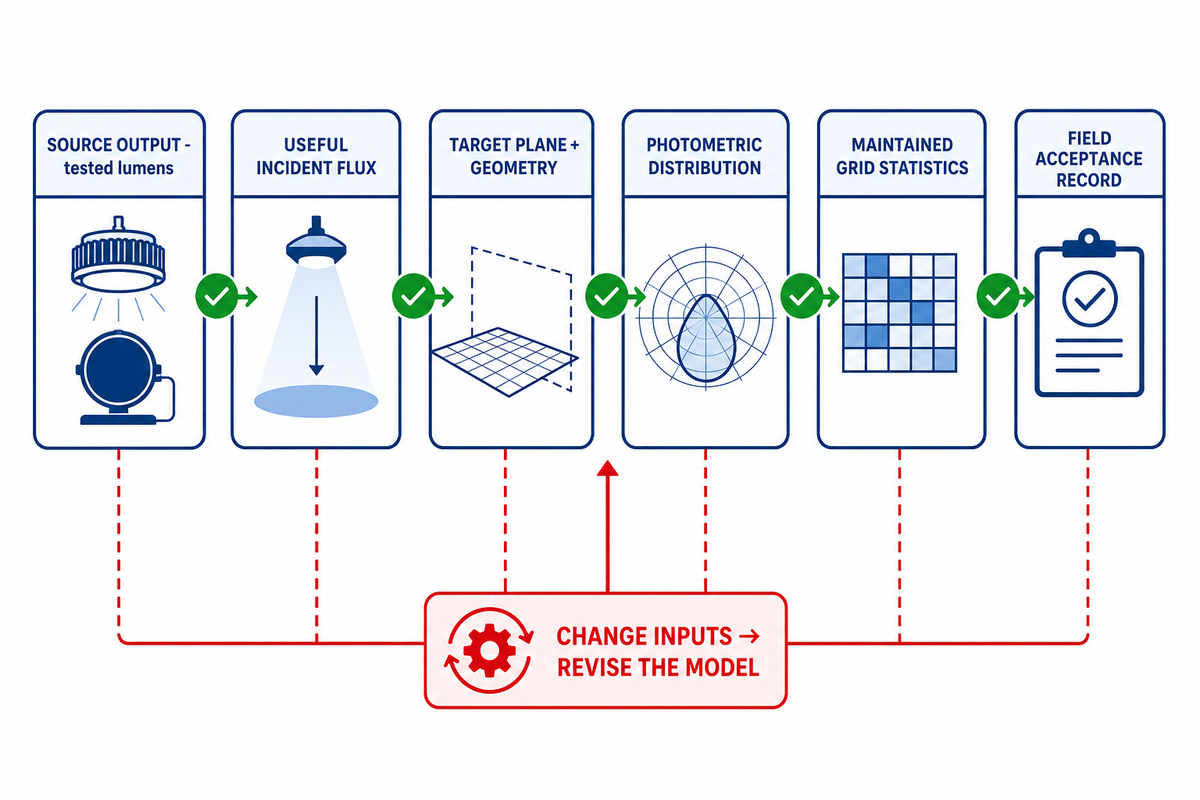
Lumens tell you how much visible light a source emits. Lux describes how much arrives on a defined surface. The conversion starts with the NIST SI unit relationship and becomes decision-grade only after you expose useful incident flux, area, distribution, distance, angle, losses, grid statistics, and measurement conditions.
Start with the target plane and current application criterion. Request the photometric file and geometry. Separate initial from maintained results. Agree on the field grid and meter conditions before installation. That chain protects buyers from both under-lighting and the equally expensive mistake of adding output without improving the required outcome.
Keep the calculation package with the final quotation and commissioning record. When optics, mounting, controls, surface geometry, or maintenance assumptions change, revise the model instead of carrying the old lux result forward. Traceability is what turns a comparison into a repeatable engineering decision.
Need a target-surface lighting review?
Share the application, target plane, mounting geometry, maintained criteria, and available photometry. Include the target statistic, calculation grid, control states, and acceptance method so the discussion remains auditable. GQLAMP can discuss the right flood-light configuration and the evidence needed for project verification.
References & Sources
- NIST Guide to the SI, Chapter 4, Table 3 SI units for luminous flux and illuminance.
- CIE e-ILV 17-21-039 luminous flux.
- CIE e-ILV 17-21-060 illuminance.
- CIE e-ILV 17-21-085 lux and foot-candle relation.
- CIE e-ILV 17-25-104 and 17-25-105 photometric distance law and inverse-square special case.
- Illuminating Engineering Society definition of illuminance point-level areal density.
- ISO/CIE 19476:2014 illuminance-meter and luminance-meter performance and calibration conditions.
- IES Lighting Library and IES Standards Cross-Reference current fundamentals, application, calculation, and measurement resources.
- IES PS-06-24 responsible outdoor-lighting principles and current resource links.
- CIE 129-1998 historical scope context for exterior work-area lighting; not used for current target values.
Trending now

![Industrial LED Bulbs: Bases, Voltage & Heat [Checklist]](https://gqlamp.com/wp-content/uploads/2026/10/industrial-led-bulbs-blog-featured-150x150.png)